
作为PTE考试最刻骨铭心的特色题型,Describe Image一直是困扰广大考生的难点。今天墨尔本文波PTE继续从阅卷官角度为大家详细讲解相关的解题技巧和注意事项。
- Identify the type of image. Is it a graph, picture, map, chart, or table? The approach for handling each image type is slightly different.
分清题型类别,每种题型的应对方法都略有不同。
- Take notes if you need to. Use the Erasable Noteboard Booklet and pen provided. Do not write full sentences; briefly list any important features you see.
适当做笔记,不要写全句,简要写得分点(尤其是关键数据)。
- For graphs, charts, and tables, be sure you understand what is being measured and in what units it is being reported.
对于图表类图,确定统计的对象和单位。
- Try to determine what the main point of the image is. You should be able to answer the question, “What is the image mainly showing?”
定位得分点,问自己图上主要展现的特征是什么。
- Maps and pictures will often have obvious features highlighted. Use words and phrases that describe the locations of features within the image, for example, on the left/right, next to, above, below, and so on. If objects are particular colours, these may help you identify them, for example, the countries marked in yellow. The same is true for sizes and shapes, for example, the large square, the smaller circle.
地图题和照片题常有突出的关键特征;尝试用描述方位的表达来描述这些特征的位置;可以用颜色、大小或形状来分别指代不同对象。
- Graphs, charts, and tables often show trends or changes. Use words and phrases that describe the trend or movement. For example, increase, decrease, rise, fall, remain stable/steady, and so on. Use phrases to describe the speed at which the changes happen, for example, a sudden increase, a slow decline.
图表类题通常会有改变的趋势,尝试用描述趋势变化的词以及描述变化发生快慢的短语搭配。
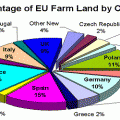
- Pie charts show proportions. The size of the “slices” indicates the relative size of whatever is being measured or counted. The actual numerical values for the slices are usually provided. Be sure to mention these values. If the slices are equally sized, say so, using words and phrases such as equal, the same, about the same, similar, If the slices are different – the usual case – use comparatives and superlatives to describe them, for example, the smaller or the two export categories, the largest group of people, the most popular option, the least common answer, and so on.
饼图说比例,通常会给具体数值(可能是百分比也可能是单位数据),确保要说几组数据。如果有类似大小的分类,放一起说。比例大小的差别通常用比较级和最高级配合描述,以划线部分为例。
- For all graphs, charts, and tables, look for a pair of extreme values – for example, the highest and lowest, the largest and smallest, the most expensive and cheapest – identify them by name and describe them using the values for their measures or counts.
所有题型都建议大家找一组最值(注意是相对的两个),分别说明和列举数据。
- While you are speaking, if you lose your train of thought, of fine yourself at a loss for words, do not remain silent. The microphone turns off automatically if there is no sound for three seconds. If you need to pause to think or check you notes, use pause fillers such as um, uh, Let me see, and so on. Saying something – anything – is better than saying nothing because one the microphone turns off, you cannot turn it on again.
保证不停顿,整理思路时适当用一些语气连接词。
更多内容尽在墨尔本文波PTE!