雅思A类小作文柱状图向来是高频考题,但是质量合格的柱状图范文却不多,今天墨尔本文波雅思为大家分享原创雅思范文,希望对大家有所借鉴。
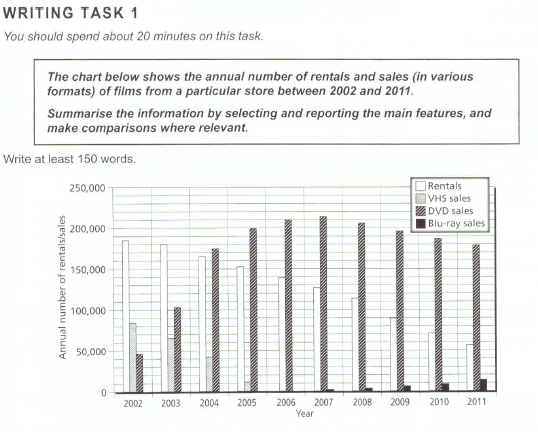
The bar chart illustrates how many films were rented and sold from a certain shop from 2002 to 2011. 第一段改写
It is clear that the number of movies rented and VHS sold remained decreasing within the time frame. While DVD sales experienced an initial increase before a gentle decrease, Blu-ray sales had been on the rise before 2011. 第二段总括
Film rentals and VHS sales witnessed a similarly downward trend, with the former decreasing from 175,000 to slightly over 50,000 in 2011 and the latter dropping from over 80,000 and finally vanishing in 2006. It is interesting to note that 2006 is the only year shown in the picture with two formats of films sold or rented.
The disappearance of VHS sales ushered in the advent of Blu-ray sales, which sprouted out in 2007 and increased gradually ever since before ending at a little bit over 10,000 in 2011. DVD sales was the only format that had seen fluctuations, starting at about 50,000 before peaking at 210,000 in 2007, after which the trend reserved, ending at about 175,000.
第三段和第四段最值及趋势。
175 words
微博:@墨尔本文波雅思
微信:wenbo-tv
微信个人号:wenbo_tv


