墨尔本英语补习-墨尔本英语学习
很多同学不会拼读,核心是26个字母本身的发音可能性不熟悉。今天墨尔本文波英语的文波老师就给大家熟悉下26个字母的发音可能性。
谢谢大家。 有更多英语学习可以咨询微信号:Wenbo0450918888

很多同学不会拼读,核心是26个字母本身的发音可能性不熟悉。今天墨尔本文波英语的文波老师就给大家熟悉下26个字母的发音可能性。
谢谢大家。 有更多英语学习可以咨询微信号:Wenbo0450918888

孩子想学习,但是情不自禁刷手机视频,怎么办?
Continue reading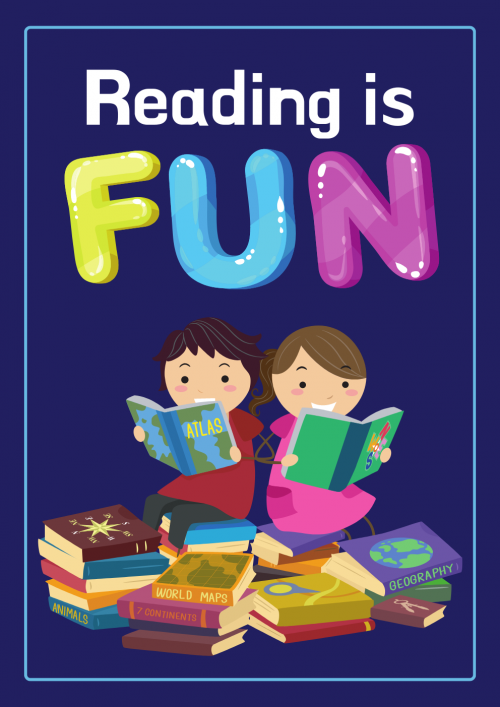
孩子不爱读英文书,怎么办?
Continue reading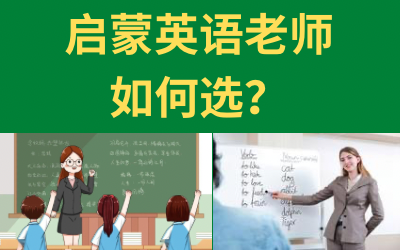
启蒙英语老师家长如何选择?
Continue reading
澳洲奖学金考试需不需要背单词?
Continue reading
长久以来,受中文表达习惯的影响,很多英语初学者都喜欢用make和let 来表达“让我们怎样怎样”。一来,这样不地道;二来,很多搭配是错误的。 Continue reading

如何激发孩子的英语阅读兴趣?如何对孩子的英语启蒙? 如何让孩子阅读和写作能力超群?英语到底如何地道? Continue reading
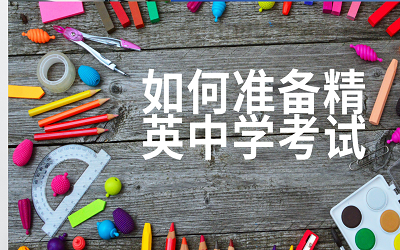
澳洲精英中学考试和私校入学考试以题目难,时间紧,词汇量大而著名,如何中长期去准备?今天文波老师就用一道精英女校的题,来给大家讲解下。 Continue reading

没有Medicare在澳大利亚接种新冠疫苗是免费的吗?是的。无论是拥有PR或者Citizen的澳洲居民,还是只是持有工作签和临时签证在澳大利亚停留的人,都可以免费借种新冠疫苗。但是,非PR和Citizen的同学注意了,接种疫苗前要申请一个IHI 号码,否则还是要收费的。 Continue reading
英文动词如何生动?如何描写别人外貌?
Continue reading
大家在澳洲打过急救电话吗?当发生意外需要救护车的时候,应该如何打电话求助呢?
Continue reading